The analysis is made of two parts:
- The first part consists of the analysis of task descriptions. Based on their contents, we try to group them into several types, eg: we classify the task described as ‘model hyperparameters optimization’ into the data science category.
- The second part focuses on task times, ie. differences in work patterns every day of the week or months of the year – for example, ‘which day of the week do we finish work the earliest?’
There were several things we wanted to explore and confirm:
- Will the company’s shift from development toward data science be visible?
- Do the projects require more developers than data scientists early on, then switch as the project progresses?
- Are the overall proportions of development/management stable?
- What are the typical working hours?
- What is the most usual time for a lunch break?
- Do we finish working earlier on Fridays?
- Which month of the year do we work the most?
- How has the total amount of work done increased with the company’s growth?
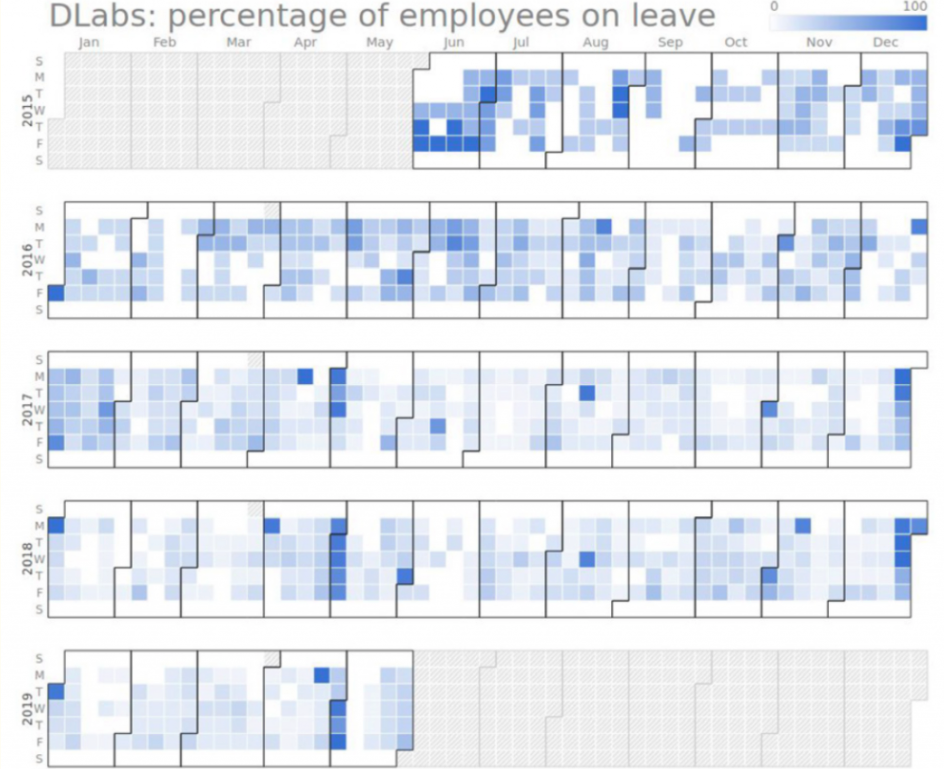
- What are the most popular dates for vacation?
The report is based on data exported from the time-tracking system used by DLabs.AI and covers the period from June 2015 to May 2019 – the full four years. There were approximately 65.000 records describing specific tasks to be done.